
Often, we might have a big question about apps that consume the most network bandwidth on our PC. At that time, understanding the internet usage of these apps is may necessary. Perhaps, we need to know even about their activity history too. In this article, we want to learn how a network manager benefits us to find them out?
What is Smart Network Manager?
Smart Net Manager is a powerful software for Microsoft Windows to monitor, control, and manage our system.
Let’s start.
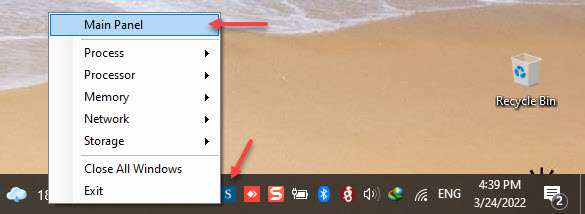
Open the application dashboard by right-clicking the Main Panel menu. (as in figure 1)
The Dashboard panel helps us access brief info about various system units. (Figure 2)
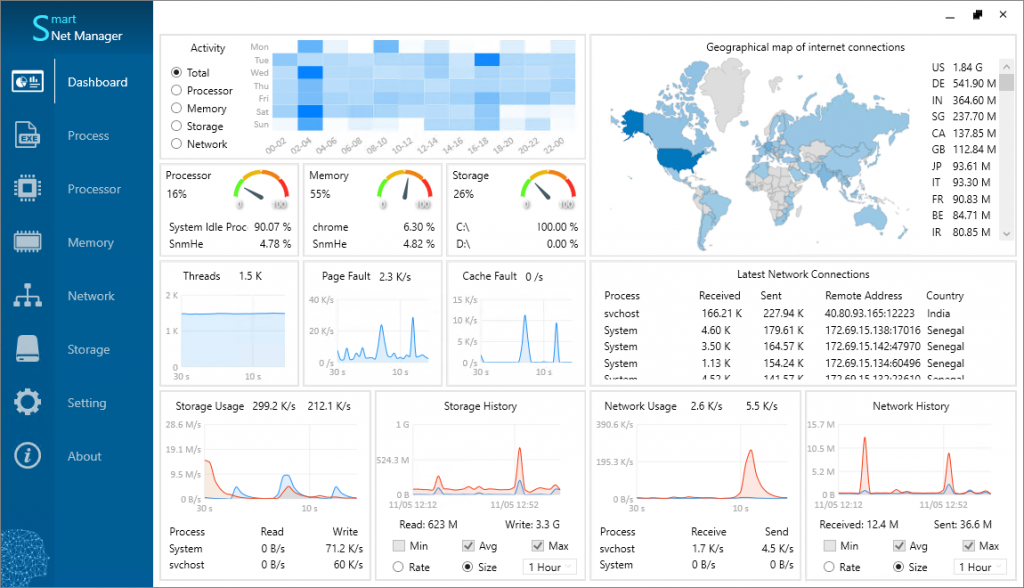
Since we are introducing Smart Net Manager as a network manager now, let us touch upon only the network base sections in this article. We will also explain its other parts in different writings.
A Live Network Connection Manager
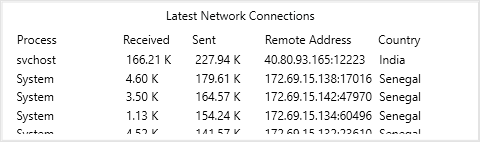
The Latest Network Connections section (Figure 3) displays the connected remote IPs to our system. We also have the details of connections. To be precise, it shows:
- The process names have connected to remote IPs
- The country name of remote IPs
- Send and receive sizes of processes
A Live Network Rate Manager
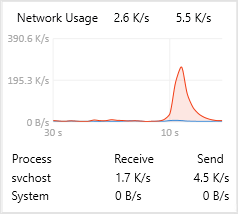
The Network Usage section (Figure 4) shows the network live rate of our system using a diagram. It also gives send and receive rates of processes. This section refreshes its info every second and keeps them for 30 seconds too.
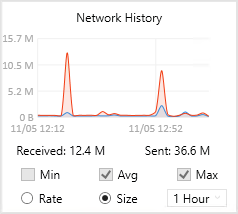
A Network History Monitor
The Network History section (Figure 5) displays the network history of our system. This diagram has two modes Size and Rate. We can see the sent and received sizes by selecting Size mode (the default), and the speed values by picking Rate mode. In addition, these modes have three options (Min, Avg, Max) that show us the Minimum/Average/Maximum size/rate info.
Tools of The Smart Network Manager
The Dashboard panel shows only a summary. But, we can go to another page to access the detail of network activities. So, Find and select the Network menu on the left blue menu bar and click it. (Figure 6)
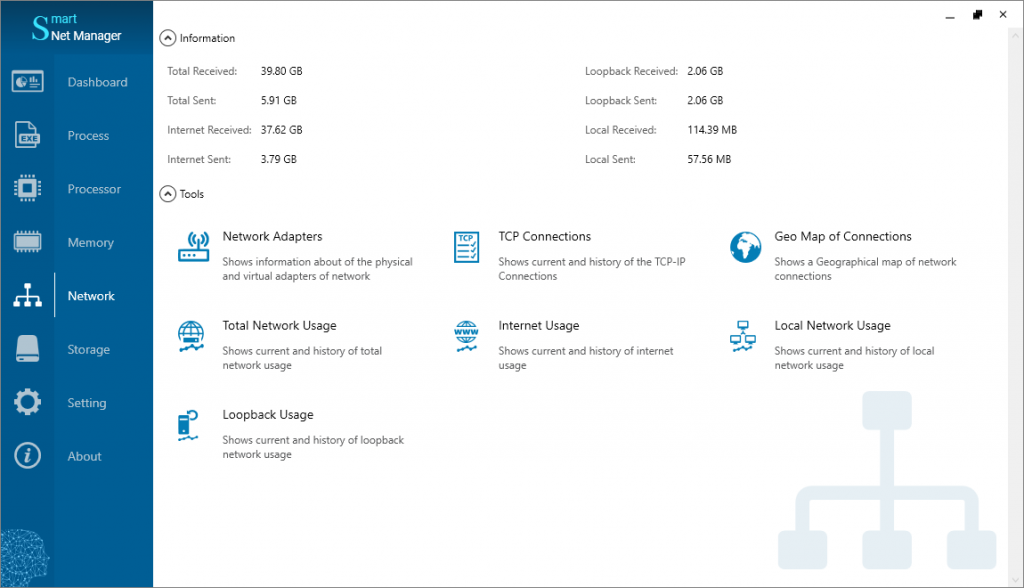
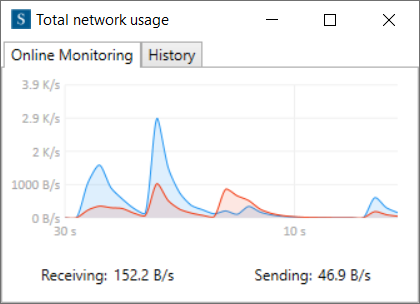
Click the Total Network Usage button on the Network panel. A window will open that contains two tabs.
The Online Monitoring tab monitors the current network bandwidths using a diagram (Figure 7). This diagram also displays the receiving and sending live rates.
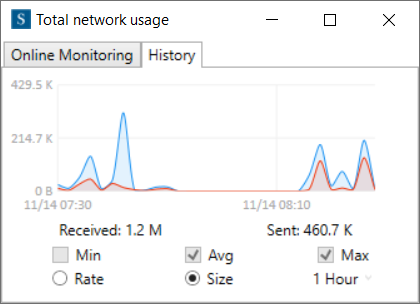
The History tab shows the network history of our system (Figure 8). This section is like Network History on the Dashboard panel that we have explained before (Figure 5).
Local Connections
The Smart Net Manager software can detect the local connections and monitor their live/history sizes/rates. We can load this window by clicking the Local Network Usage button on the Network panel. (Figure 6)
Loopback Connections
Loopback connections are the internal connections of a system. This application displays info about those too. This window is also accessible by clicking the Loopback Usage button on the Network panel. (Figure 6)
Internet Connections
All network connections with public IPs are Internet connections. The Smart Net Manager distinguishes these IPs and monitors them. Read this article to have more info about Internet monitoring. Doing click the Internet Usage Botton on the Network panel loads this window.
How to Monitor All Network Connections?
Sometimes, we like to know which process has opened connections and what its remote endpoints are. After clicking the item TCP Connections button on the Network panel (Figure 6), the opened window will list them completely. (as in figure 9)
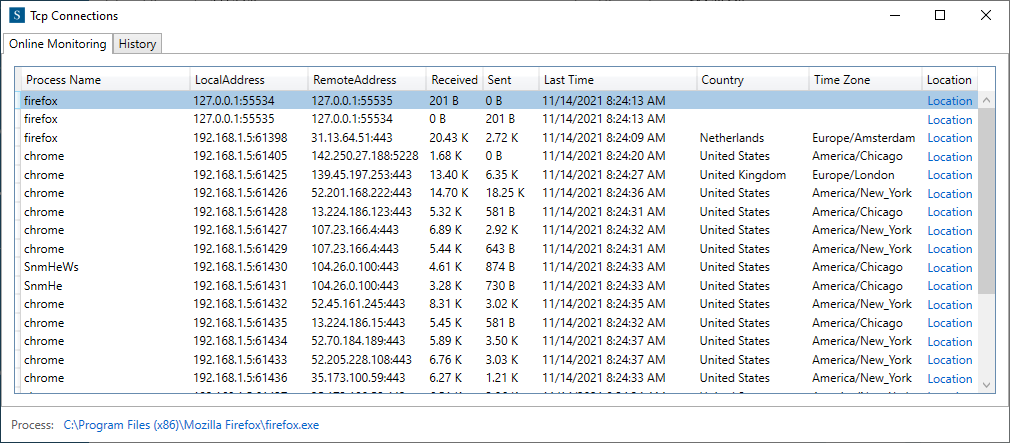
Here is more info about these columns:
- The Process Name column shows the name of the process that has opened a TCP tunnel.
- The Local Address column gets us the local IP and port number that the process has used.
- The Remote Address column gets us the remote IP and port number that the process has connected.
- The Received and Sent columns indicate the data sizes of the process.
- The Last Time column defines the last transmission time.
- The Country column displays the country name of the remote IP.
- The Time Zone column gives the time zone of the remote IP.
- The Location column is a link. we can see the location of related remote IP on the google map by clicking it.
But, no data exists in the last three columns if the type connection is loopback or local.
A Map for Network Connections
We can find one section on the top right of the Dashboard panel. It displays some brief info about the system’s network usage. Of course, this map is also accessible by clicking the Geo Map of Connections button on the Network panel. (Figure 6)
This map shows the countries where our system has a connection or more with them.
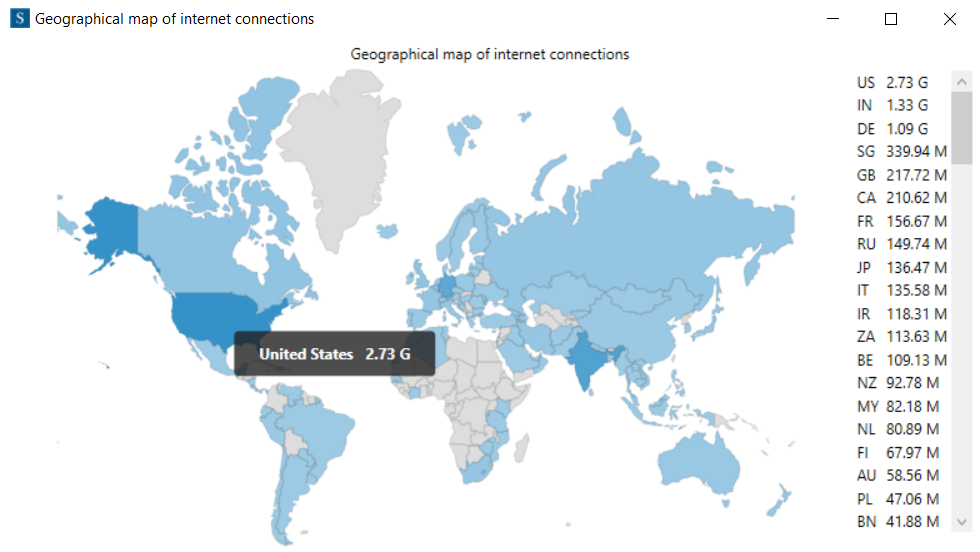
It is also possible to see the bandwidth of the system and a country individually by keeping the mouse on that country.
The countries with darker colours have had more data transmission with the system. Furthermore, there is a list on the right side of the window. It contains all countries and their transmitted data size separately. This window also sorts the country names by their bandwidth usage automatically.
Network Adapters of the System
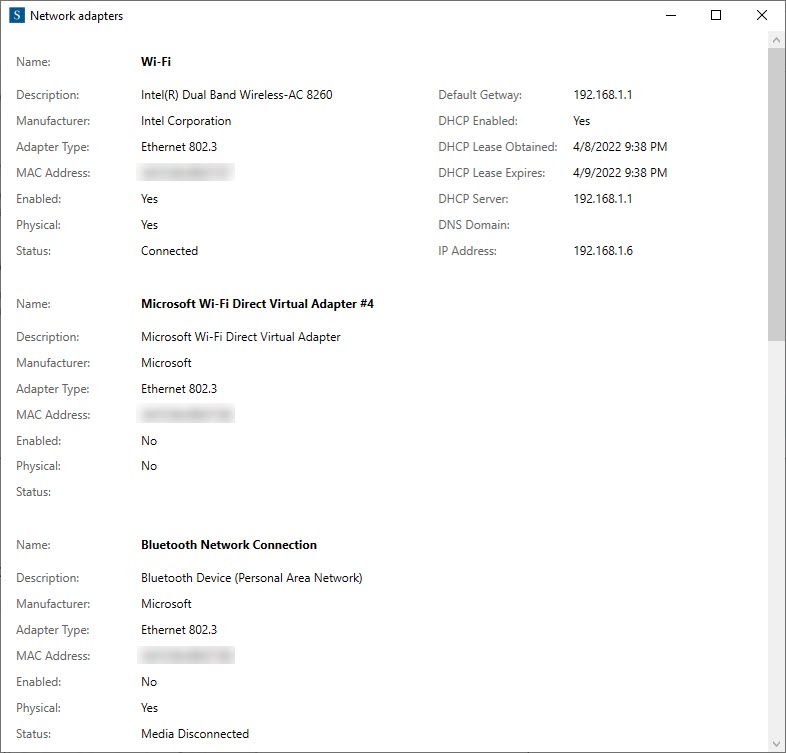
Smart Network Manager Displays complete info about all network devices connected to our system. (Figure 11)
Here are the details that SNM gives us about the network adapters:
- Name and Description
- Manufacturer
- Adapter type
- Mac Address, IP Address, and Default Gateway
- DHCP Info and DNS Info
- Physical, Virtual, and Availability status
You can try Smart Net Manager using this link. Or, you are welcome to visit this website to have more details.