
In this article, we want to explain how we monitor network activities in Windows 10 and later. We will also introduce a simple network manager called Smart Net Manager.
Let’s dive in.
How to Monitor Network Activities in Windows?
The following sections help us learn how to get information about network connections using the default tools of the Windows operating system.
Monitor Network Bandwidth Using Task Manager
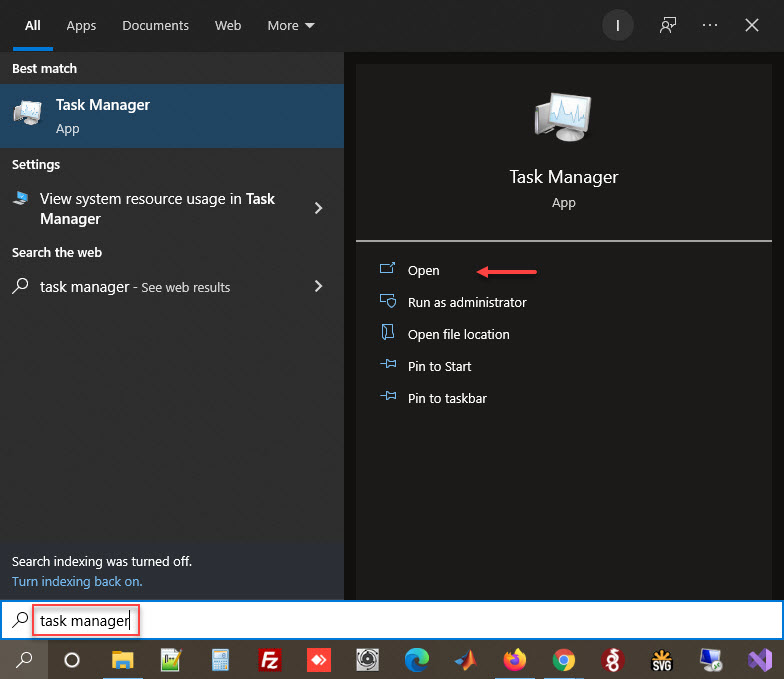
Write the ‘task manager’ phrase to the search area in the taskbar. Then, click the Open link when the Task Manager application appears. (Figure 1)
You also can watch this video to have more information about Task Manager.
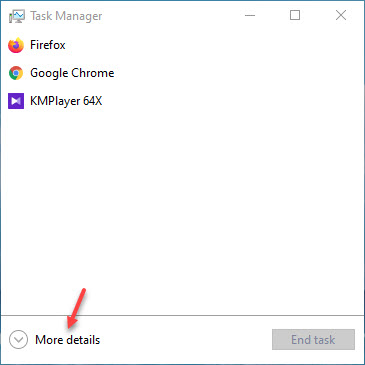
Find and click the More details link If the Task Manager is in Fewer details mode. (Figure 2)
Now, we can see more tabs on the Task Manager window. So, click the Performance tab as in figure 3.
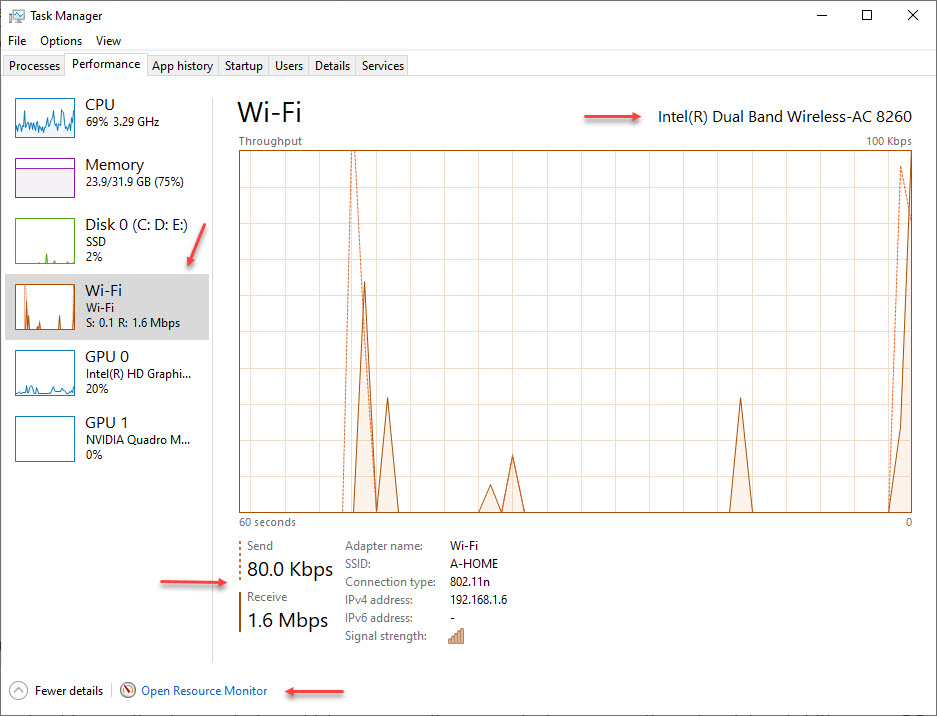
Find and select your network connection type on the left panel of the opened windows. We have chosen our Wi-Fi device in figure 3. We can see the device’s name at the top of the right-side panel. Furthermore, the send/received data rates and more network information such as Adapter name, SSID, Connection type, IPv4, IPv6, and Signal strength exist at the bottom of the same window.
Monitor Network Connections Using Resource Monitor
Click the Open Resource Monitor link at the lowest line of the window in figure 3. And then, select the Network tab on the opened Resource Monitor window. (Figure 4)
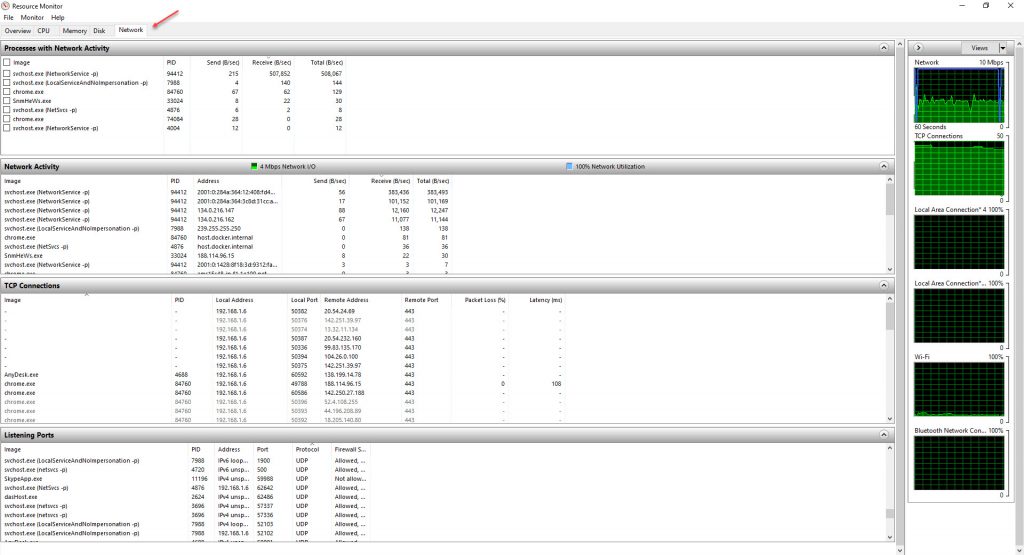
The left panel of the Network tab has a few sections. Let’s review them in the following:
Process With Network Activity
Indicates briefly the processes that have sent/received data.
Network Activity
We can find all the network connections and their processes in this section. The Address column also shows destination addresses. In addition, three columns display the data sent/received/total rates per process.
TCP Connections
This section filters and shows the TCP connections of network activities. We also can find the connection’s local/remote IPs/Ports and their bandwidth per process.
Listening Ports
If we want to find out what a port’s status is or which ports are listening now, this section is too helpful. It also represents the name, PID, protocol type, end even firewall status of processes.
Monitor Network Activities of a Process
It is possible if we want to monitor the network activities of a process. Let’s learn more using an example. We have selected chrome.exe for monitoring in figure 5.
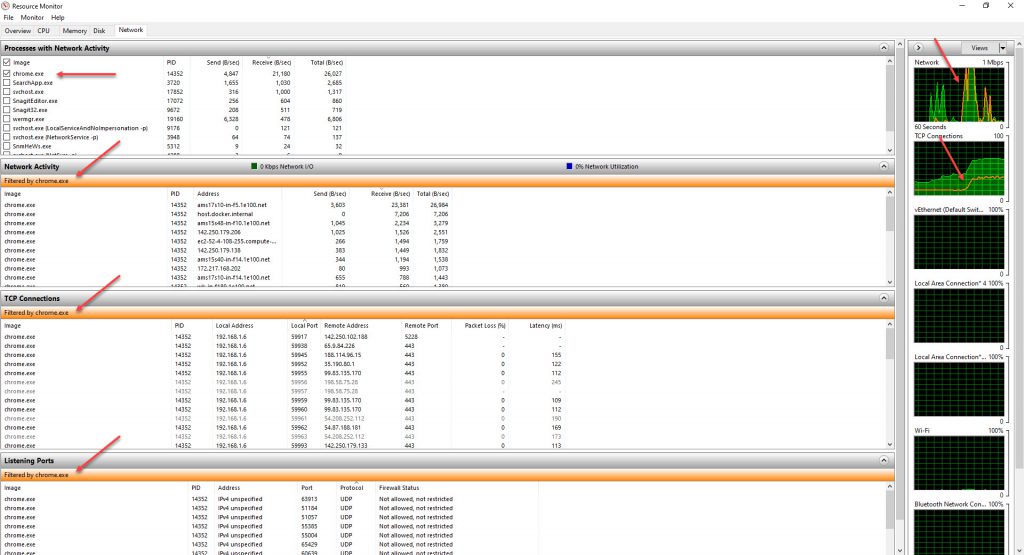
Once we select a process like chrome.exe, the other three sections show an extra orange header with a text like ‘Filtered by chrome.exe‘, as in figure 5. It means these sections represent only the connections of chrome.exe, for example.
Live Network Diagrams
Other options that Resource Monitor gives us are various live diagrams. They show the online bandwidth of network adapters. This section has two charts at least. The topmost shows total network bandwidth, and the second shows TCP connections’ rate. It also contains one diagram per network adapter that displays its live speed.
Let’s look at the right-side diagrams in figure 5 again. They have orange lines too if we see them carefully. These lines indicate the bandwidth of chrome.exe particularly (in that example, of course). So, it is also possible to have the live network bandwidth diagram for a process individually using Resource Monitor.
A Network Monitor Tool for Windows
Now, It is time to introduce a powerful software product called Smart Net Manager. It helps us to monitor the network activities of our operating system. (Figure 6)
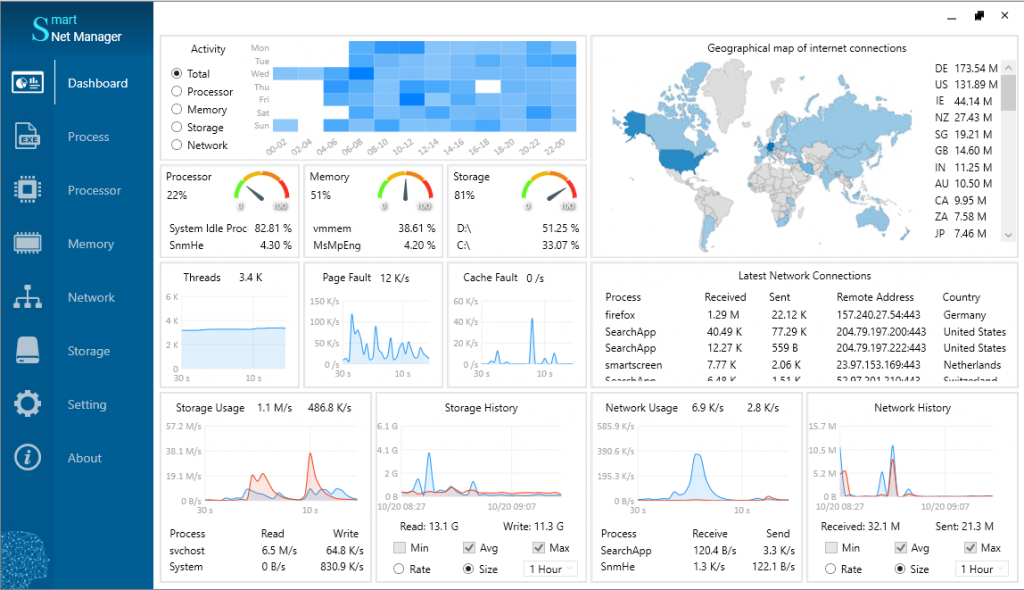
Here are the network utilities of Smart Net Manager:
- Displaying network adapters and their detailed information, such as:
- Name and Description
- Manufacturer
- Adapter type
- Mac Address, IP Address, and Default Gateway
- DHCP Information and DNS Information
- Physical, Virtual, and Availability status
- TCP Connections Monitoring
- All online Connections
- Last 100 connections per process
- Showing Process name, Local/Remote IP/Port. Sent/Received data sizes, Last connection time
- Showing the Country name, Time zone, and location of remote IPs
- Geographical Map of Internet connections
- Data usage per country
- Online/History Rate/Usage Monitoring of:
- Total Network
- Internet
- Local Network
- Loopback
In addition, Smart Net Manager has good utilities for managing processors, memories, storage devices, and even applications.
You can try it using this link. Or, you are welcome to visit this website to have more details.